
News
Arctic Sea Ice in a Changing Climate: Variability, Trends, and Implications for Navigation
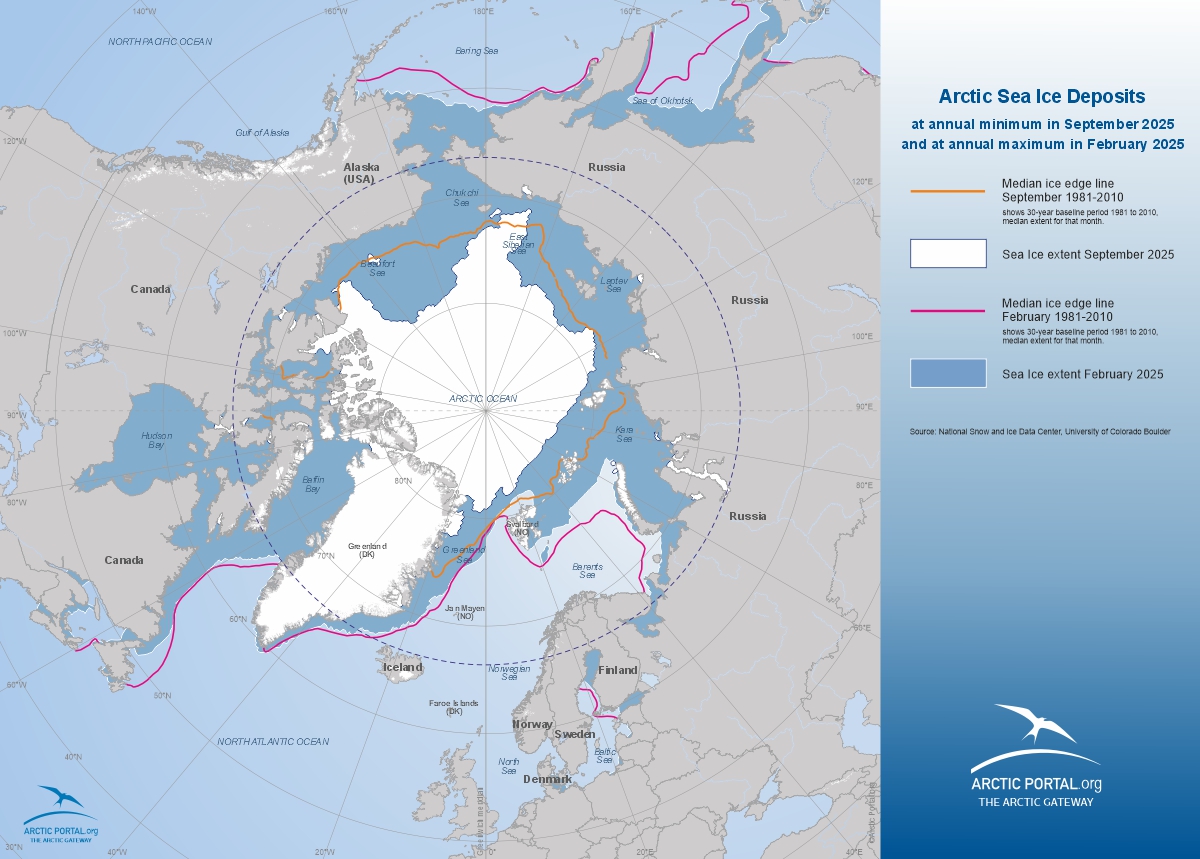
Arctic sea ice follows a strong seasonal cycle, reaching its annual maximum toward the end of winter and its minimum at the end of summer. Newly updated maps in the Arctic Portal map gallery now show the maximum sea-ice extent in February 2025 and the minimum extent in September 2025, providing an up-to-date view of sea-ice conditions in the Arctic.
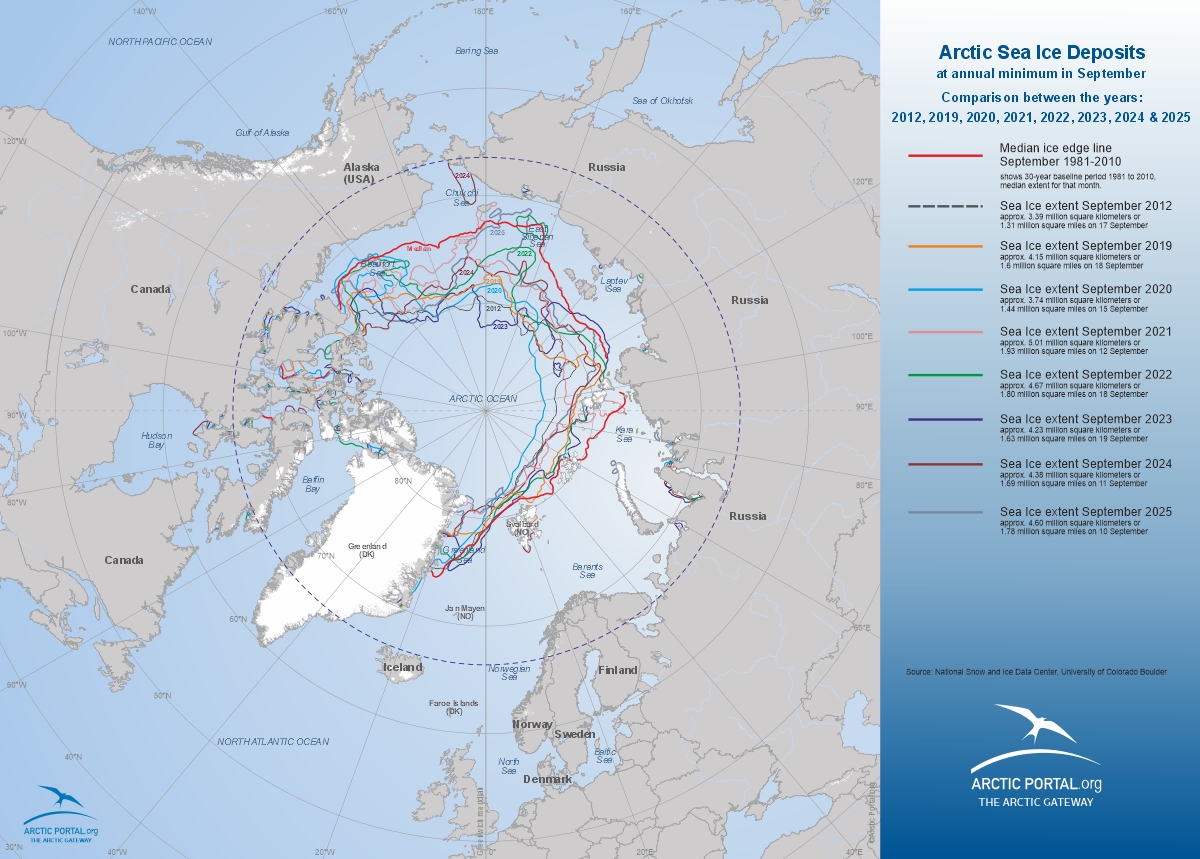
 These are presented both as separate seasonal map and, in a map, showing a combined comparison for September sea-ice extent for the years 2012, 2019, 2020, 2021, 2022, 2023, 2024, and 2025, offering a clear visualisation of the seasonal differences in especially the minimum annual ice cycle.
To place current conditions in a longer-term context, the maps also include the median ice edge for February and September from the reference period 1981–2010. This allows recent ice conditions to be directly compared with historical norms and highlights how the Arctic sea-ice cover has evolved and reduced over recent decades.
Seasonal extremes and long-term change
The February 2025 map captures the Arctic near its annual maximum ice coverage. While winter sea ice still extends across much of the Arctic Ocean, comparisons with the 1981–2010 median ice edge reveal notable regional differences, reflecting the broader changes of reduced ice cover observed in Arctic sea ice over time. It should further be noted that the total ice mass is reducing, due to less thickness of annual winter ice, which is also a critical environmental consideration.
In contrast, the September 2025minimum illustrates the Arctic at the end of the melt season, when sea ice reaches its lowest annual extent. This period is particularly important for tracking long-term change, as summer sea ice has shown a pronounced decline over recent decades. The September median ice edge from 1981–2010, shown on the map, highlights how recent minima is considerably less in cover than historical conditions.
 The comparison map of February and September 2025 further emphasizes the scale of the seasonal transformation, showing how large areas of the Arctic transition between ice-covered and largely ice-free conditions within a single year.
Variability between years
In addition to long-term trends, the Arctic Portal gallery includes maps from multiple years, illustrating the substantial year-to-year variability in Arctic sea ice. Atmospheric conditions, ocean heat transport, and weather patterns all influence how much ice forms during winter and how much melts during summer.
This variability means that individual years may depart significantly from the long-term average, reinforcing the need for continuous observation and regular updates. The Arctic sea-ice system is not only changing over time, but also fluctuating from one year to the next in ways that are highly relevant for practical applications. See the comparison map.
 Implications for Arctic navigation
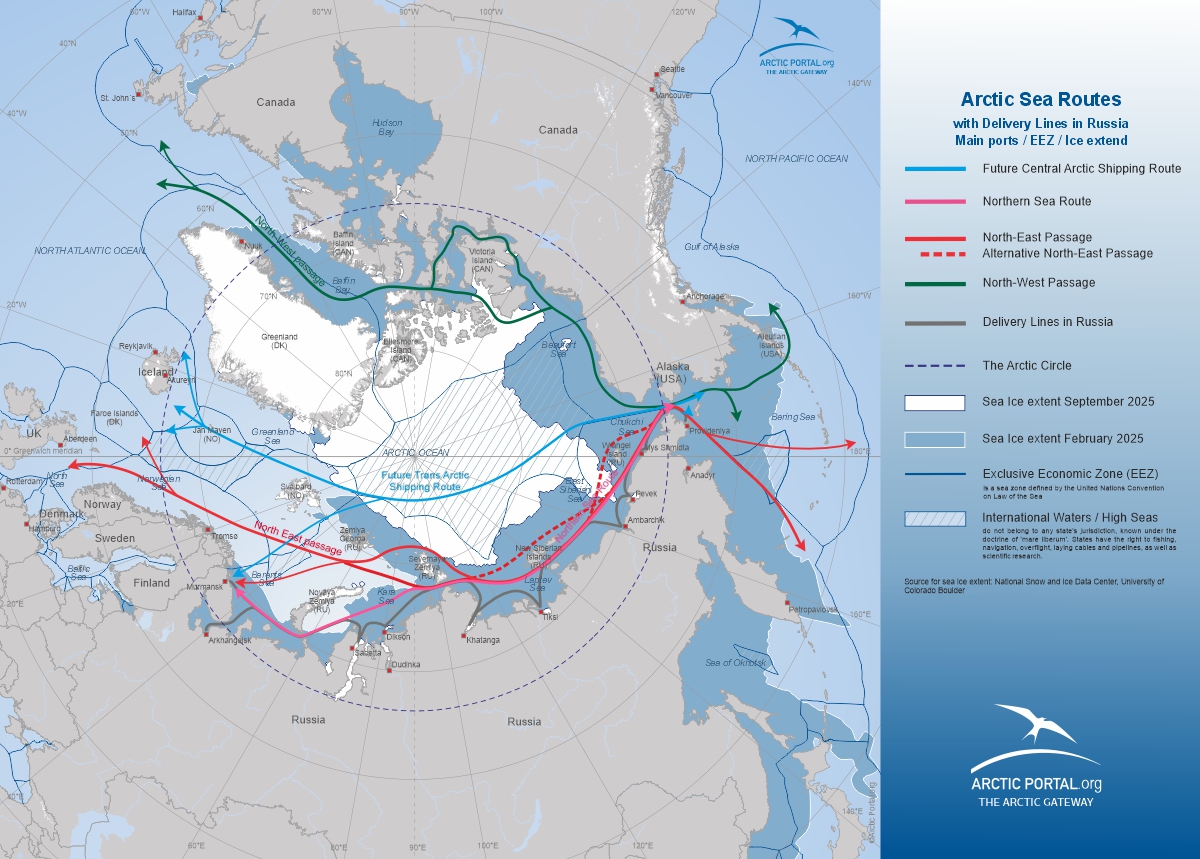
One of the most visible consequences of reduced Arctic sea ice is the growing interest in Arctic shipping routes. The route most directly influenced by summer ice conditions is the Northern Sea Route, also known as the Northeast Passage, which runs along the Russian Arctic coast.
In years with reduced summer ice extent, parts of this route can become navigable for longer periods, particularly for ice-strengthened vessels and with icebreaker assistance. However, the maps also show why Arctic navigation remains challenging and how distribution and condition can differ from year to year. Even during years with low overall ice extent, ice distribution can be uneven and highly dynamic.
The strong interannual variability highlighted in the Arctic Portal gallery underlines the importance of up-to-date sea-ice information for navigation planning, safety, and risk assessment. Conditions that are favorable one year may differ substantially from the next.
Continued updates and monitoring
The newly updated February and September 2025 sea-ice maps in the Arctic Portal gallery provide an important snapshot of current Arctic conditions, set within both a seasonal and historical framework. By combining recent observations with long-term reference periods and previous years, the maps support a deeper understanding of how Arctic sea ice is changing and why sustained monitoring is essential from both economic and environmental perspectives.
The Arctic Portal sea-ice maps will continue to be updated as new data becomes available. The next update is planned in early March when the February 2026 maximum ice extent has been reached, ensuring that the gallery remains a timely and reliable resource for tracking ongoing changes in the Arctic.
For further information on Arctic Shipping, please visit the Arctic Portal Shipping Portlet.
Please visit our Map Gallery to view all our available maps.