Using data gained from observations, NASA scientists have created a variety of animations and visualisations - including the first 3-D model of the Greenland Ice Sheet - to better illustrate the changes happening in the Arctic.

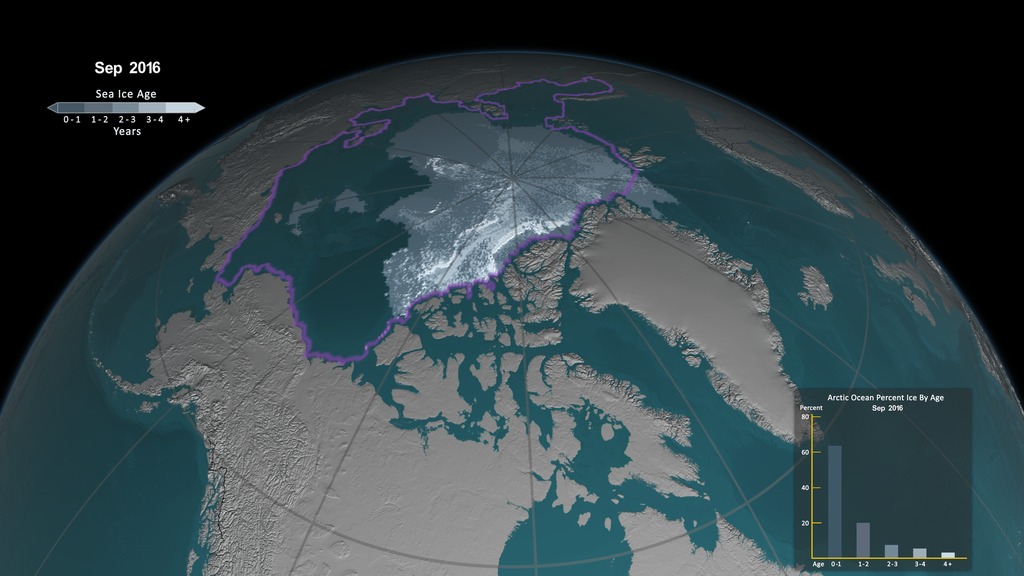
The most recent one, the Weekly Animation of Arctic Sea Ice Age with Two Graphs: 1984 - 2016, shows the rapid decline in perennial sea ice (which is the portion of the sea ice that survives the summer melt season) since the year 1984.
The animation, created by NASA's Scientific Visualization Studio, show the seasonal variability of the ice, growing in the Arctic winter and melting in the summer. In addition, this also shows the changes from year to year, depicting the age of the sea ice in different colors.
“What we’ve seen over the years is that the older ice is disappearing,” said Walt Meier, a sea ice researcher at NASA’s Goddard Space Flight Center in Greenbelt, Maryland.
The visualisation is based on data provided by scientists at the University of Colorado Boulder, who developed a way to monitor Arctic sea ice movement and the evolution of its age by using satellite passive microwave instruments that measure the microwave energy emitted by sea ice, which is influenced by the ice’s temperature, salinity, surface texture and the layer of snow on top of it.
Another visualisation - which became the first-ever comprehensive 3D model of layers deep inside the Greenland Ice Sheet - is based ice-penetrating radar data. Each layer in the ice sheet provides a record of what Earth’s climate was like at the dawn of civilization, during the last ice age, or even further back in time when EArch experienced its last warm period.
